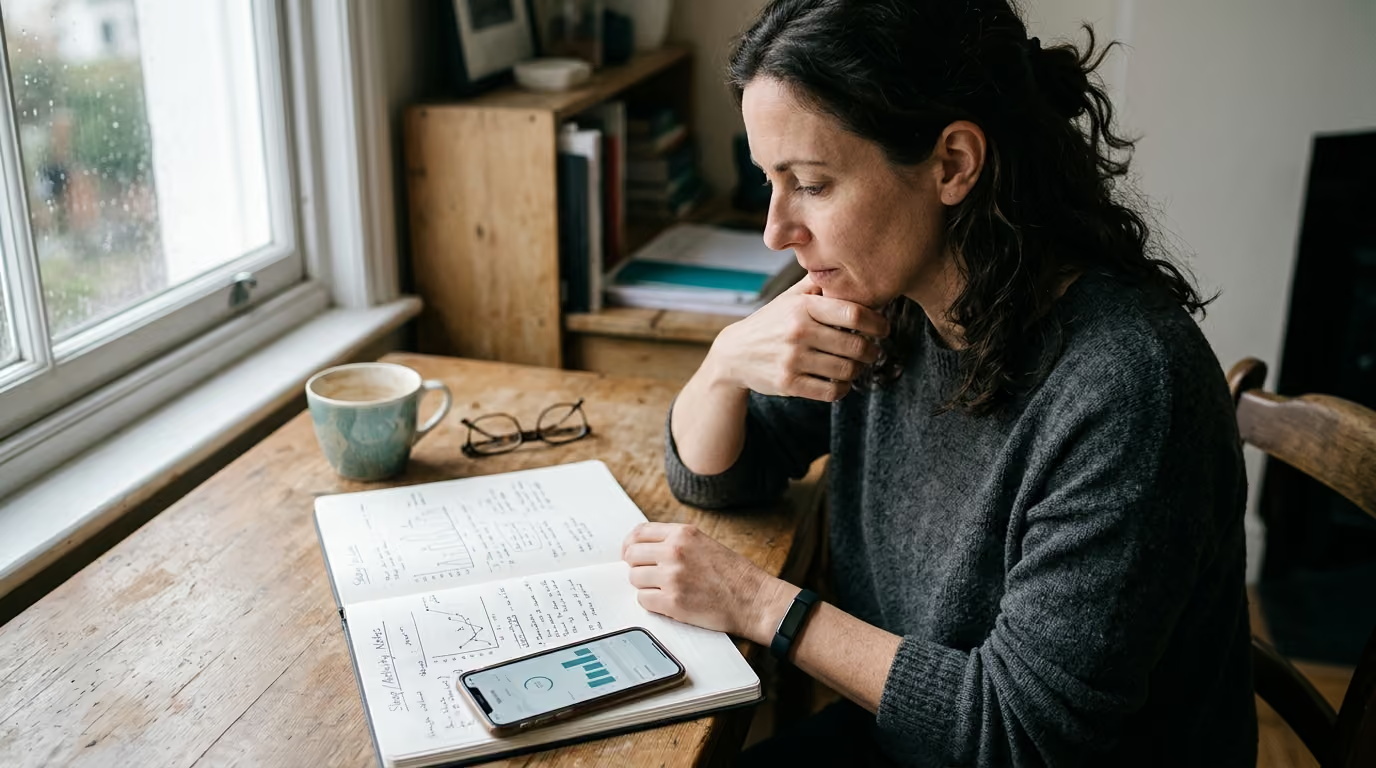

Accurate interpretation of sleep tracker data helps you evaluate device metrics objectively and understand what commercial monitors can realistically reveal about your rest.





A consumer sleep tracker is an indirect pattern-estimation tool. It is not a miniature sleep laboratory mounted on your wrist, finger, or nightstand. Understanding this distinction is the foundation of using sleep data productively. Most modern wearables and bedside monitors process movement, heart rates, and respiratory signals to estimate when rest occurs.
These devices can offer helpful feedback about long-term sleep schedules, bedtime consistency, and broad rest trends. They cannot directly measure brain waves, nor can they diagnose complex medical conditions. When individuals treat commercial sleep scores as absolute physiological truth, sleep metrics often create unnecessary worry.
This resource breaks down how consumer sleep devices function across different form factors. It examines what peer-reviewed research reveals about measurement accuracy, metric boundaries, and data interpretation. It also provides a structured protocol to help you use tracking tools without increasing nighttime stress.
Peer-reviewed evaluations present a clear picture of what consumer sleep monitors can and cannot accomplish. The underlying evidence base is strong for basic sleep-wake detection and long-term sleep timing. Evidence is mixed for precise sleep-stage division, and evidence is limited regarding diagnostic capability for clinical sleep disorders.
Systematic reviews comparing consumer hardware to clinical polysomnography show that accelerometer-based devices classify sleep versus wakefulness with reasonable consistency. Many consumer wearables achieve sleep-wake detection accuracy near 90 percent in healthy adult populations. They accomplish this by identifying sustained stillness and characteristic drops in movement.
Accuracy drops significantly when devices attempt multi-stage sleep classification. Systematic evaluations demonstrate that three-stage or four-stage classification algorithms fall into an accuracy range between 65 percent and 75 percent. Algorithms frequently struggle to differentiate light non-REM sleep from deep slow-wave sleep or rapid eye movement periods.
Recent direct validation studies comparing popular commercial rings, smartwatches, and wristbands against medical sleep testing confirm high sensitivity for detecting sleep periods. Sensitivity often exceeds 95 percent in healthy adult research cohorts. However, stage-specific sensitivity ranges widely between 50 percent and 86 percent across different devices.
The empirical consensus is straightforward. Consumer monitors excel at observing broad schedules, movement levels, and multi-week routine shifts. They are unreliable for calculating exact minutes of specific sleep stages or proving whether quiet wakefulness was actual sleep.
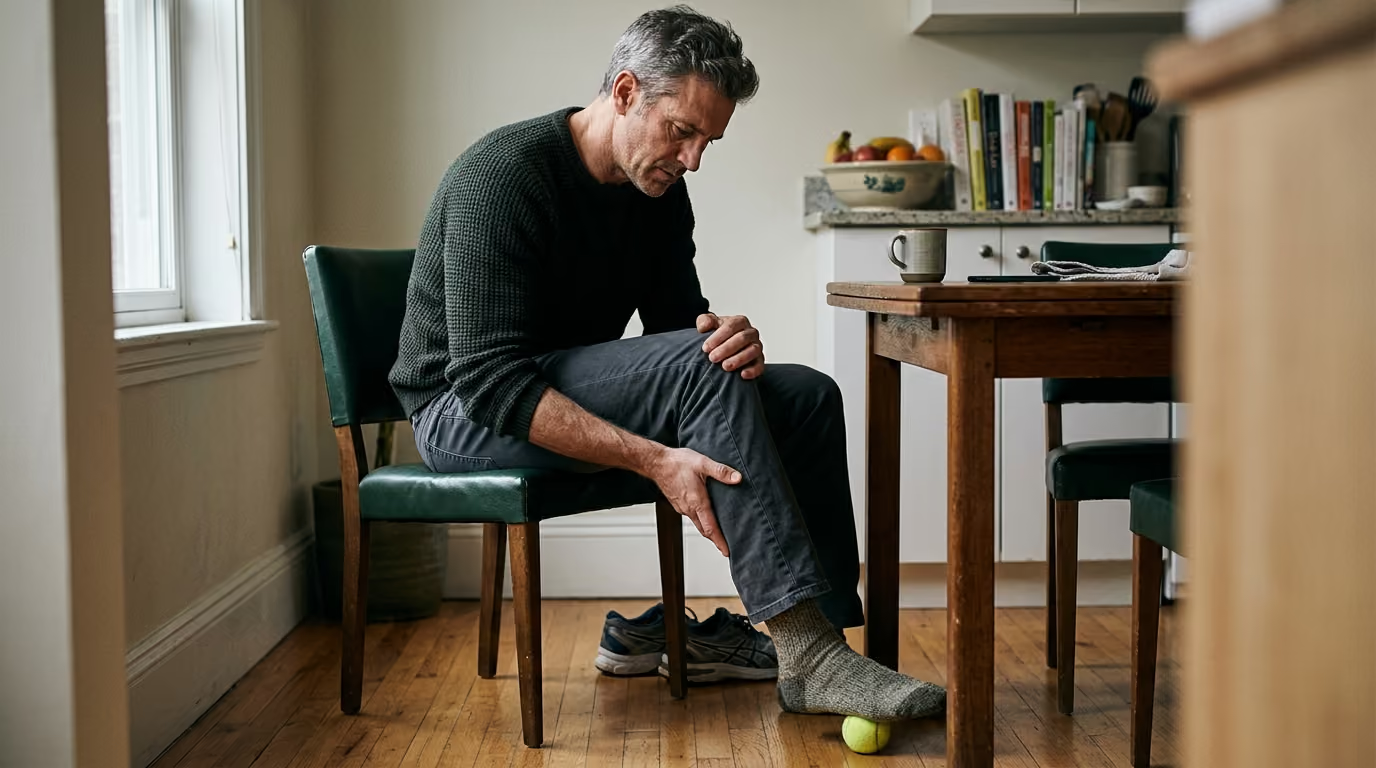
As adults enter their late thirties and middle years, night rest naturally undergoes physiological shifts. Deep slow-wave sleep gradually declines, nighttime awakenings become more frequent, and circadian timing can shift subtly early or late. People often notice that their physical resilience and daytime focus do not bounce back as quickly after a short night.
These biological transitions prompt many individuals to seek external answers through digital rest tracking. When a wearable displays a lower score or reduced deep sleep total, individuals may worry that their body is failing. This fear often heightens nighttime vigilance, making it harder to unwind naturally.
Understanding the limitations of sleep technology helps put digital rest scores into perspective. Recognizing that indirect optical sensors frequently misinterpret quiet wakefulness prevents misinterpreting normal midlife sleep shifts as severe medical dysfunction. It allows you to focus on practical changes rather than chasing an arbitrary digital target.
Connecting tracker data with lifestyle habits offers useful feedback. If you want to review practical strategies for supporting restorative sleep quality, reading about habits for better sleep quality provides useful context. Tracking should serve your everyday well-being, rather than becoming another stressful performance metric.
Different sleep-tracking tools use distinct sensing methods, structural designs, and mathematical models. Each category comes with clear trade-offs regarding comfort, signal stability, and measurement accuracy.
Wrist-worn devices combine three-axis accelerometers with photoplethysmography sensors. Accelerometers track wrist movement and positional orientation. Photoplethysmography shines light through the skin to measure micro-changes in blood volume, calculating heart rate and pulse-rate variability.
Smart rings measure movement and circulatory metrics through finger arteries. The blood vessels in the fingers are close to the skin surface, providing a clean pulse signal for photoplethysmographic sensors.
Bedside devices use short-range radar, radio-frequency signals, audio micro-sensors, or under-mattress pressure pads. They eliminate the need to wear physical hardware during sleep.
Mobile apps estimate rest using internal phone movement sensors, room audio analysis, or light detection. The phone is typically placed on the mattress or nightstand.
Sleep diaries capture personal observations, mood, timing, and behavioral context. Standardized tools like the Consensus Sleep Diary collect set self-reported measures each day.
Medical professionals use specialized tools depending on the clinical question.
Consumer dashboards convert raw physical signals into standard sleep metrics. Understanding these definitions helps clarify what your device is calculating.
Time in bed represents the total interval between initial sleep attempt and final exit from bed. Total sleep time estimates the actual minutes spent asleep within that window.
Trackers calculate total sleep time by subtracting estimated time to fall asleep and nighttime wake periods from time in bed. If a device misses silent awakenings, total sleep time will be overestimated.
Sleep-onset latency measures the minutes required to transition from full wakefulness to initial sleep. Wake after sleep onset measures total minutes awake between initial sleep onset and final morning awakening.
Accelerometers struggle with sleep-onset latency because lying still without moving looks algorithmically similar to light sleep. Wake after sleep onset is easily underestimated when nighttime wakefulness lacks physical movement.
Sleep efficiency represents total estimated sleep time divided by time in bed, multiplied by 100. A score above 85 percent is typically considered efficient in clinical contexts.
Sleep midpoint marks the exact middle timestamp between sleep onset and final awakening. Tracking your sleep midpoint reveals subtle changes in your body clock. If you want to understand how shifting sleep midpoints alter daily energy, exploring circadian rhythm shifts after 35 offers valuable insights.
Sleep architecture refers to the structure and distribution of non-REM light stages, non-REM deep slow-wave sleep, and REM sleep across the night.
Subjective sleep quality is your personal assessment of how restful, refreshing, and stable your sleep felt. It does not always match digital metrics. You can register low tracker efficiency yet wake up feeling energized, or record a high score while feeling daytime exhaustion.
Comparing commercial devices to clinical laboratory testing highlights clear limits in consumer technology.
Commercial wearables are capable at determining whether a person is generally awake or asleep. High sleep-wake sensitivity means that when you are sleeping, the device almost always recognizes that state correctly.
Stage classification relies on indirect mathematical models rather than brain-wave signals. Photoplethysmography tracks pulse rate and heart-rate variability, while accelerometers track movement. The device uses these proxy signals to infer whether you are in light non-REM, deep non-REM, or REM sleep.
Because these inferences rely on statistical probabilities rather than direct electroencephalography, stage classifications carry high margin for error. A device may record 45 minutes of deep sleep when a clinical monitor shows 80 minutes, or misclassify REM sleep as light sleep.
Validation studies often publish group averages across healthy research participants. A study might conclude that a device differs from clinical testing by an average of only 12 minutes across a group of fifty people.
That average group statistic hides wide individual variances. On a given night, the device might overestimate one person's sleep by 45 minutes while underestimating another's by 35 minutes. A small group bias does not guarantee individual accuracy on your wrist on a specific night.
Commercial manufacturers regularly update their sensor algorithms, processing pipelines, and score formulas through background app updates. These software updates alter how historical sensor data is interpreted.
A sudden change in your weekly deep sleep average after an app update usually reflects software changes rather than a shift in your brain physiology. Comparing sleep scores across different device brands or different software versions leads to misleading conclusions.
Multiple personal, environmental, and physiological factors influence sensor readings and sleep tracking performance.
Consumer sleep monitors are valuable when treated as directional trend guides rather than precise diagnostic tools.
Tracking excels at showing broad behavioral shifts over weeks and months. It clearly illustrates whether your bedtime is gradually shifting later, whether your schedule stays consistent, or how total rest opportunity varies across seasons.
Identifying social jetlag, the difference between weekday sleep timing and weekend sleep timing, is another strength. Watching these timing shifts over time provides practical feedback on schedule stability.
You can use a wearable to run structured lifestyle experiments. Establishing a two-week baseline allows you to measure how specific changes alter multi-night trends in rest opportunity, bedtime regularity, or resting heart rate.
Overnight heart rate and heart-rate variability trends measured by reliable wrist and ring sensors offer useful recovery indicators. A sustained baseline elevation in resting heart rate across multiple nights can indicate physical strain, upcoming illness, or inadequate recovery time.
Understanding what trackers cannot measure prevents data misinterpretation and unneeded anxiety.
No wristband, ring, or mattress sensor can provide precise measurements of deep non-REM slow-wave sleep or REM sleep. Without direct electroencephalography monitoring brain wave frequencies, stage distributions remain broad estimations.
Worrying over a single night's low deep sleep reading is counterproductive. The algorithm may simply have misclassified a quiet deep sleep period as light sleep due to subtle heart-rate shifts.
When an individual lies awake silently during periods of middle-of-the-night insomnia, movement sensors detect no motion. The device algorithm classifies this period as light sleep because physical stillness matches its basic baseline rule for sleep.
This creates a frustrating discrepancy for individuals with insomnia. The user remembers lying awake for two hours, while the digital summary shows unbroken sleep. This mismatch is a limitation of indirect movement sensing, not proof that the user misremembered their experience.
Consumer sleep trackers cannot diagnose clinical insomnia, obstructive sleep apnea, or periodic limb movement disorder. The American Academy of Sleep Medicine states that consumer sleep devices lack the clinical validation required to diagnose or treat sleep disorders.
A normal consumer sleep score does not rule out obstructive sleep apnea. An individual can experience dozens of breathing disruptions per hour while an accelerometer records normal duration metrics.
A calculated readiness score combines duration, movement, heart rate, and temperature into a proprietary index. However, no algorithm can directly quantify daily mental focus, mood, physical recovery, or cognitive performance.
Your physical sensation of alertness, cognitive clarity, and emotional stability during waking hours remains the definitive metric for evaluating sleep adequacy.
Orthosomnia describes an unhealthy fixation on achieving perfect sleep scores driven by wearable data. Individuals experiencing orthosomnia often feel anxious when viewing low digital scores, leading to heightened nighttime vigilance and sleep disruption.
Pursuing an idealized score can worsen sleep quality. When data tracking causes morning anxiety or nightly pressure, the device is compromising the rest it was intended to monitor.
Applying a calm, structured workflow allows you to collect useful schedule insights while eliminating metric-driven anxiety.
Before checking your device, identify the specific question you want to answer. Avoid checking data out of habit without a clear purpose.
Avoid making sudden lifestyle changes based on a single night's metric. Collect data quietly for fourteen consecutive days to establish a baseline of your normal sleep schedule, duration, and movement patterns.
Focus on median values across two-week windows rather than day-to-day fluctuations. Sleep naturally varies based on daily stress, physical activity, and social schedules.
Focus primarily on sleep schedule regularity. Consistent wake-up times strengthen your central circadian clock, making nighttime sleep onset more predictable.
If your device tracks sleep midpoint, aim to keep that midpoint within a narrow forty-five-minute window across both workdays and days off.
When your physical feeling contradicts your digital score, trust your body over the device. If you wake up refreshed but the app reports a low score, assume the algorithm misclassified sleep stages or missed quiet rest.
If you feel exhausted despite a high sleep score, evaluate practical factors such as daytime stress, room environments, or potential physical symptoms rather than relying on the screen rating.
Consider how to apply these rules to common practical situations:
A tracker reports eight hours of unbroken sleep, yet you experience afternoon brain fog and waking exhaustion.
Your deep sleep metric drops from ninety minutes to thirty minutes overnight following a software update.
Viewing your sleep score immediately upon waking triggers immediate worry or determines your daily mood expectations.
While research on sleep technology continues to expand, several methodological limits constrain what current evidence can claim.
The majority of commercial device validation studies recruit healthy young adults without sleep complaints, sleep apnea, or chronic health conditions.
Validation results gathered from healthy twenty-five-year-old participants do not automatically apply to fifty-year-old adults experiencing middle-of-the-night awakenings, joint pain, or hot flashes.
Commercial sleep hardware manufacturers use proprietary algorithms that are protected as intellectual property. Device makers do not publish their raw sensor data processing models or scoring formulas.
When a manufacturer releases a silent update, researchers cannot verify what mathematical assumptions changed. This opacity limits long-term scientific evaluation.
Most consumer sleep studies are observational. They show correlations between device readings and lifestyle factors, but they cannot prove direct cause-and-effect relationships.
A device showing higher night awakenings on days with late caffeine intake indicates a correlation. It does not rule out other contributing factors such as late work stress, screen exposure, or room temperature shifts.
Limited research exists demonstrating that wearing a consumer sleep tracker leads to long-term improvements in cardiovascular health, metabolic function, or clinical insomnia resolution.
Tracking sleep provides data, but data alone does not automatically transform sleep habits without targeted behavioral changes.
Consumer sleep monitors are lifestyle devices, not diagnostic medical equipment. Recognizing when to shift from personal tracking to clinical evaluation ensures safety.
If you regularly experience trouble falling asleep or staying asleep despite adequate opportunity, reading about reasons you cannot sleep when tired can help clarify underlying factors. However, persistent symptoms require formal clinical guidance.
Consider scheduling an evaluation with a physician or sleep specialist if you notice any of the following persistent signs:
When seeking medical evaluation, bring a two-week paper sleep diary alongside any long-term wearable trends. A qualified clinician can determine whether formal polysomnography or medical home sleep testing is appropriate.
Consumer sleep devices are useful tools for observing broad schedule trends and measuring long-term behavioral changes. They become unhelpful when indirect pulse and movement signals are treated as precise sleep-stage diagnostics, or when a digital screen score is allowed to override how you actually feel.
Optical PPG and movement sensors infer deep sleep from slow, steady pulse patterns and complete physical stillness. If your resting heart rate remained elevated or minor movements occurred while you slept soundly, the algorithm may misclassify slow-wave sleep as light sleep. Trust your subjective daytime energy over an indirect algorithm calculation.
Wearing wristbands or rings tightly can trap sweat, soap, and moisture against the skin, causing localized contact dermatitis. To prevent skin irritation, clean and dry the device band daily, swap wrists periodically, and ensure the band sits snugly without cutting off circulation. If wearing the device causes nighttime awareness or discomfort, remove it.
Wearing two devices simultaneously usually causes confusion rather than clarity. Different brands use distinct sensors, motion thresholds, and proprietary algorithms, leading to differing nightly scores. Choose one device, wear it consistently to capture relative multi-week trends, and avoid comparing scores across separate brand ecosystems.
For individuals experiencing persistent sleep anxiety or insomnia symptoms, a paper sleep diary is often far more practical. Paper logs track sleep opportunity windows, caffeine timing, and subjective restfulness without generating stressful sleep scores or misinterpreting quiet awake time as sleep.
Stay connected for research and practical guidance on sleep, stress, circadian rhythm and recovery. Clear ideas for adults 35+ who want better rest, steadier energy and more resilient days.



Explore practical guidance on sleep, stress and recovery without chasing every new hack, device or promise.
explore the blog